Visualization
Query Graph Visualization
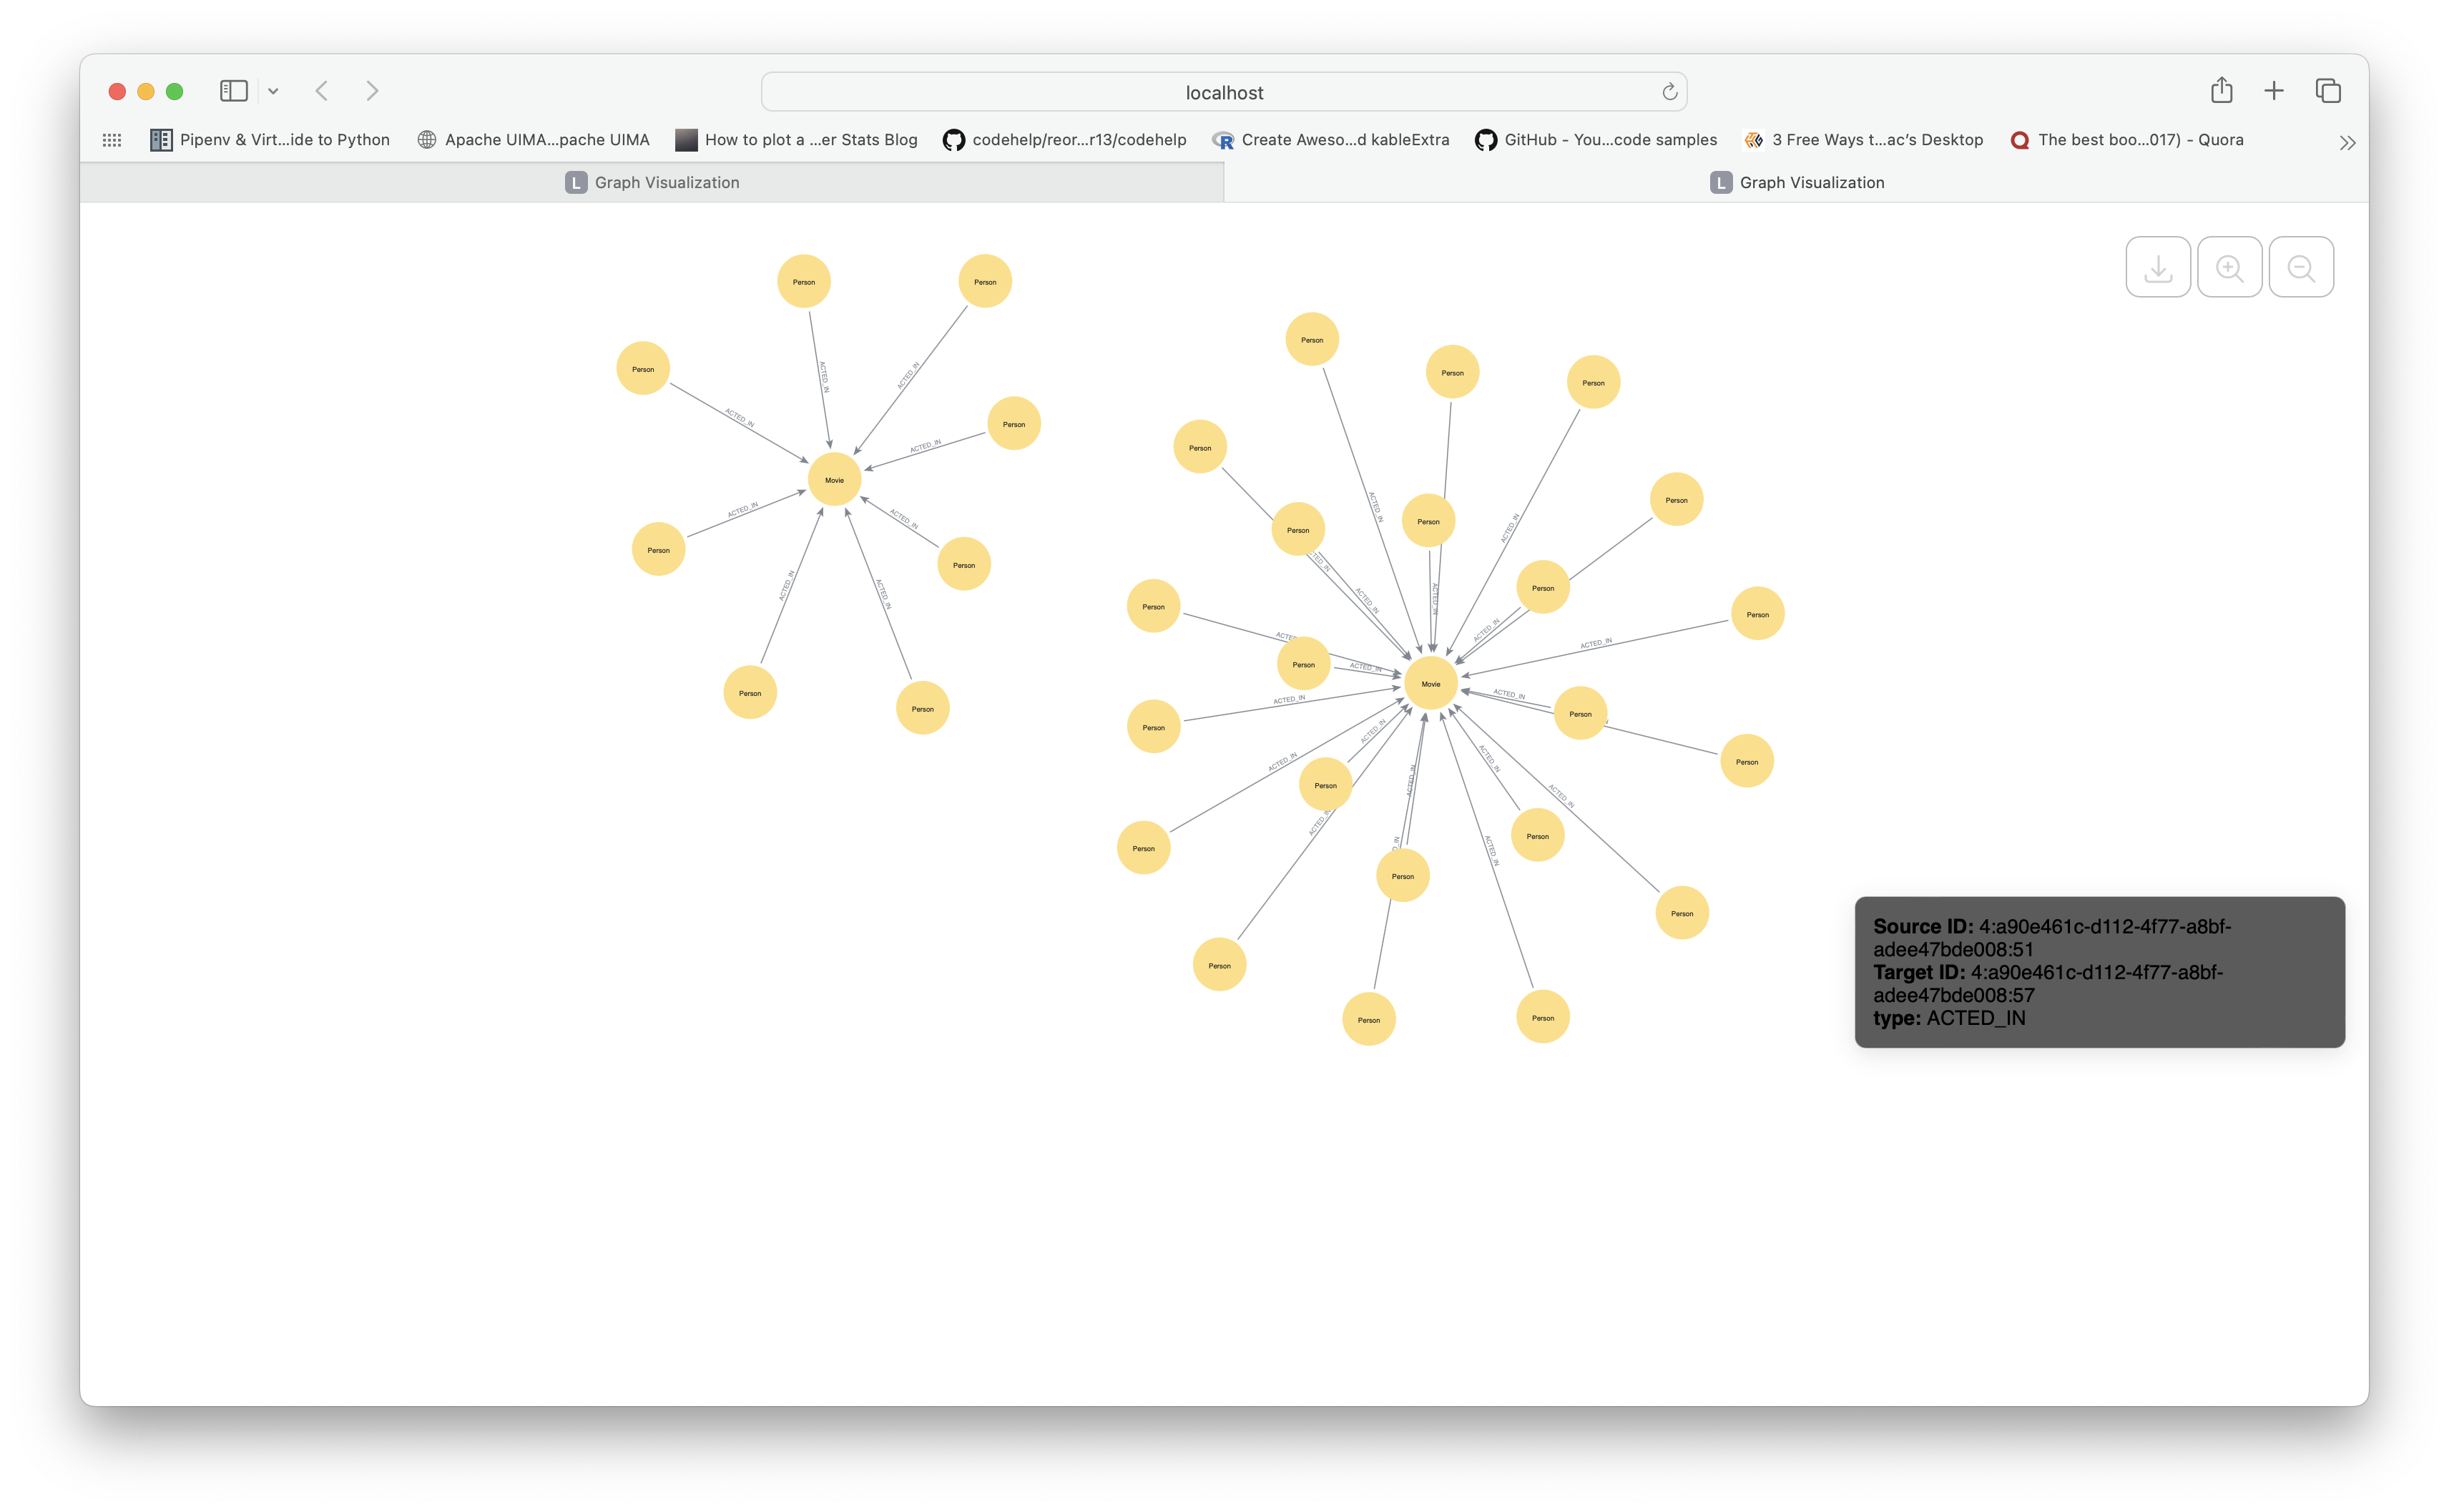
The get_query_visualization method executes a Cypher query that returns nodes
and relationships and renders the result as an interactive graph powered by the
neo4j-viz library.
Node labels are shown as captions; all properties appear as tooltips on hover. Relationship types are displayed on the edges.
query = """
    MATCH (p:Person)-[r:ACTED_IN]->(m:Movie)
    RETURN p, r, m
    LIMIT 50
"""
vg = graph.get_query_visualization(query, database='mydb')
In a Jupyter notebook — renders the graph inline:
As a standalone HTML file — open in any browser:
with open('graph.html', 'w') as f:
    f.write(f'<!DOCTYPE html><html><body>{vg.render().data}</body></html>')
You can customize the captions displayed on nodes and relationships:
vg = graph.get_query_visualization(
    query,
    database='mydb',
    node_caption='name',           # use the 'name' property as node label
    relationship_caption='type'    # use the relationship type (default)
)
Schema Visualization
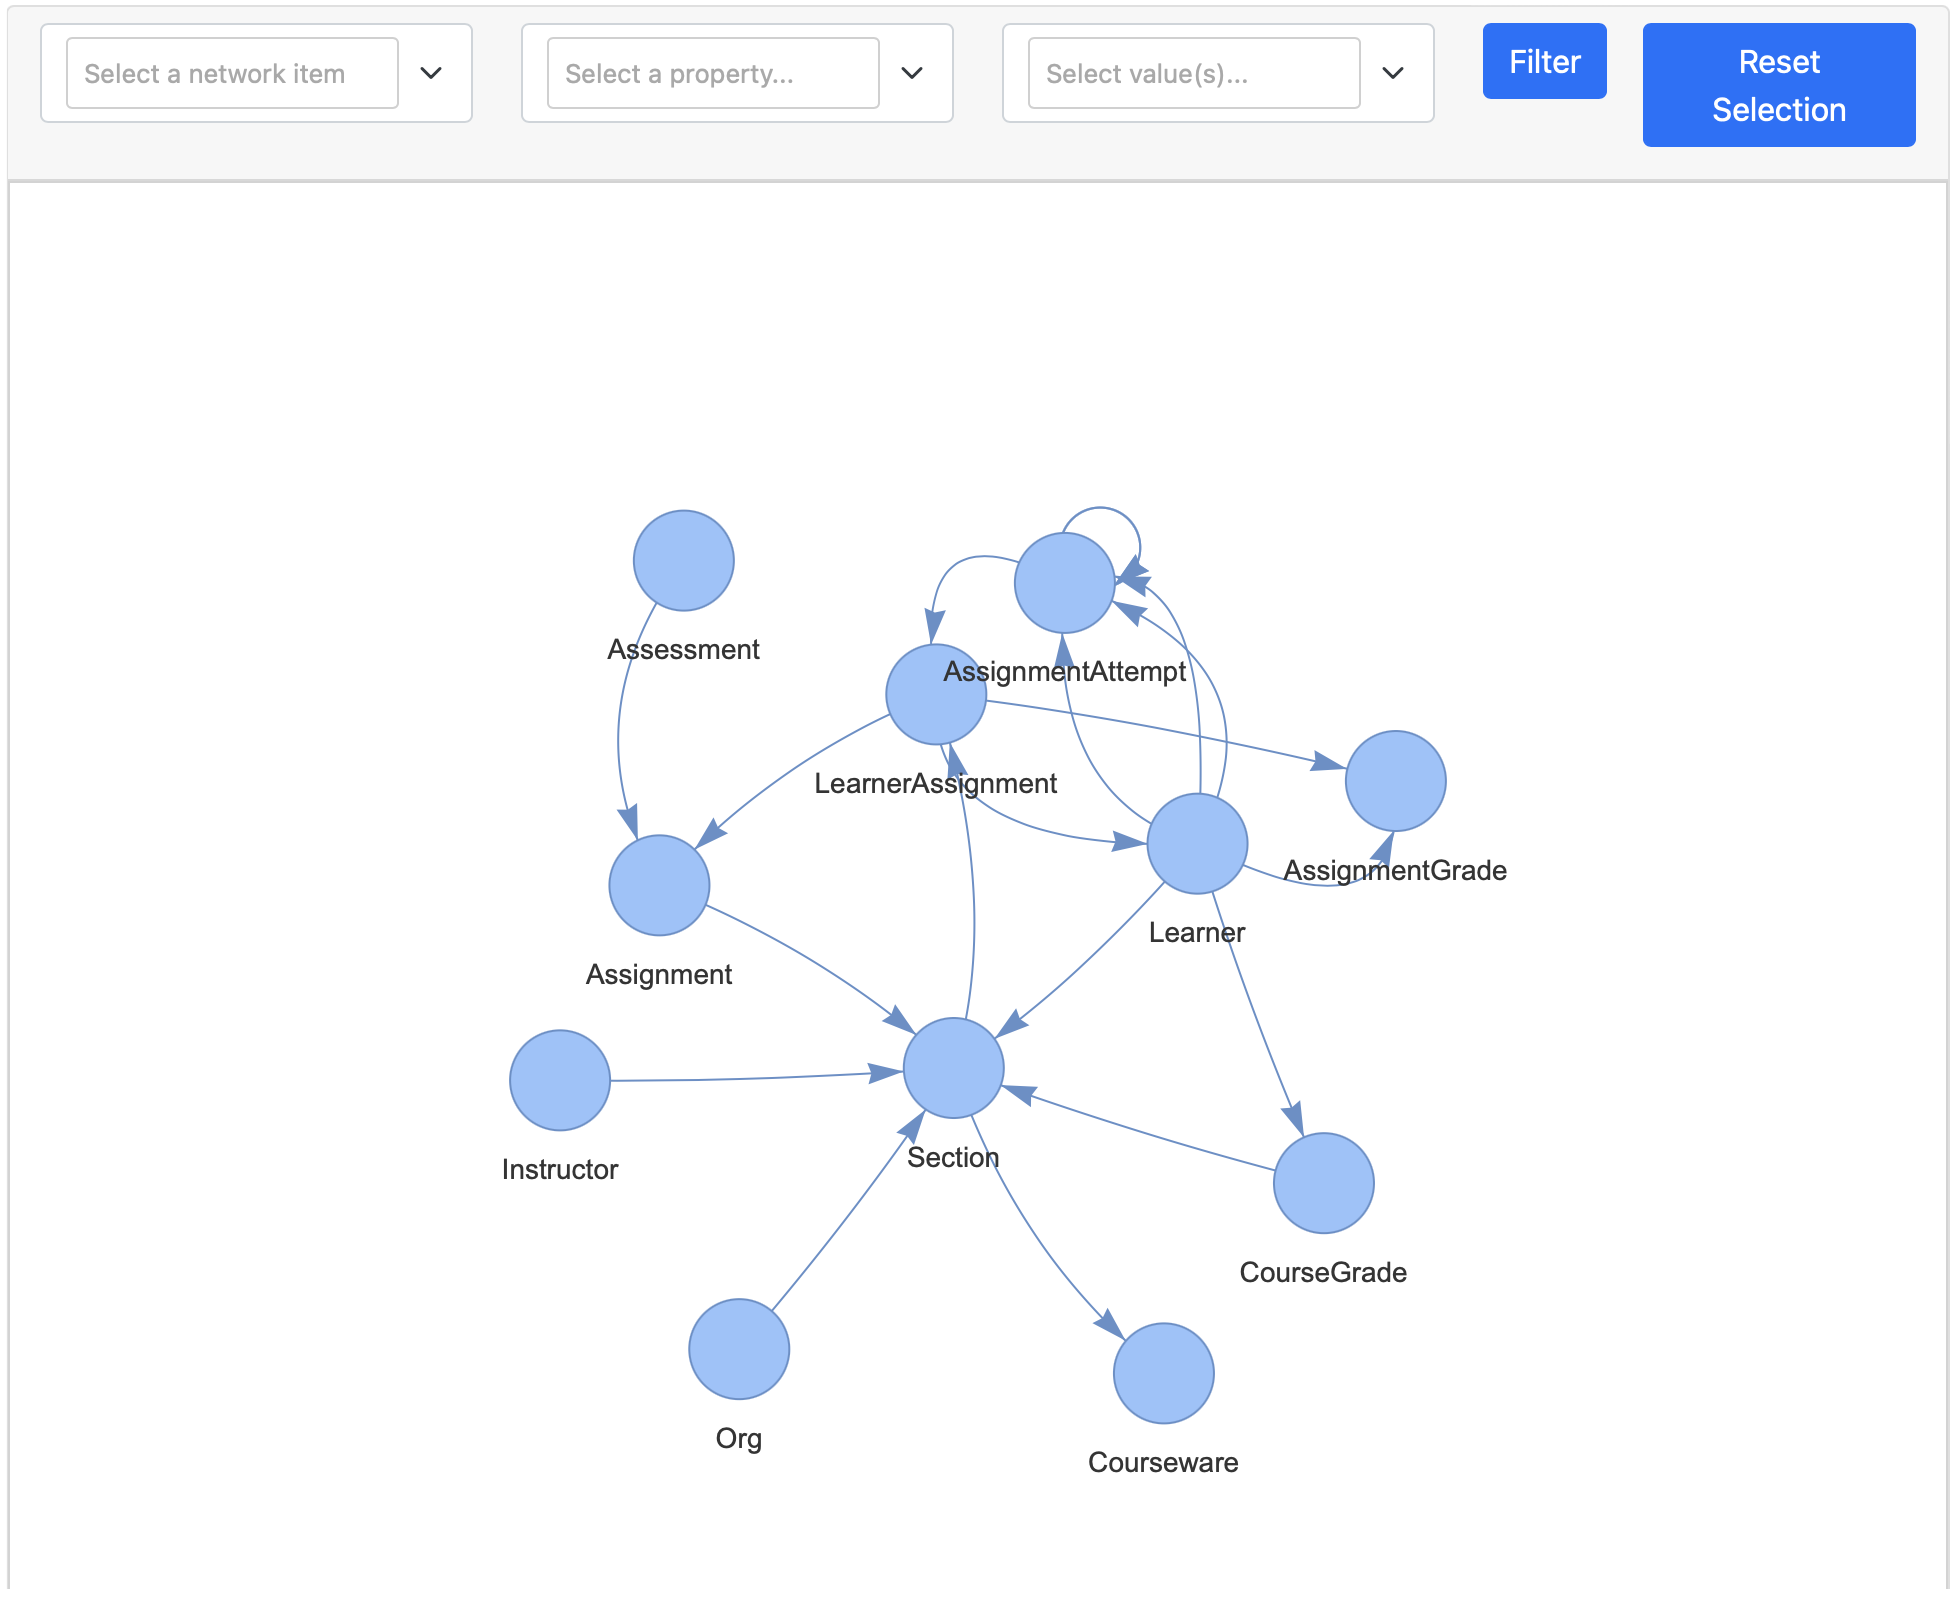
The get_schema_visualization method visualizes the full graph schema — all
node labels, relationship types, and how they connect — as an interactive graph
powered by pyvis.
Requires the APOC plugin.
Open schema.html in your browser to explore the schema interactively.